The 2025 March Madness Bracket: A Chalky Investigation
Is dissatisfaction with the field warranted?
Chalk. It’s been the trending topic of this year’s 2025 NCAA Basketball tournaments. You’ve likely already heard the narratives: The Men’s Final Four entertained all four 1-seeds for the first time since 2008. The Women’s went 1–1–1–2. It’s been a great year for the chalk, or for the folks who put together brackets where the top-ranked teams dominated.
Amongst those treetops there was finally a hint of vindication. The men’s consensus #1 Auburn and actual #1 Duke1 both crashed out against their respective #1’s Florida and Houston. The women’s game saw the lone #2, UConn, down USC to get to the championship, then win it all this afternoon. Still, none of these particularly feel like an upset, given the teams’ level of success — perennial or otherwise.
In light of these expected outcomes, a great many voices have found this all to be deeply unfun. It seems upsetting to the general audience’s palate that a highly successful team could continue along their path of least resistance with (mostly) unfettered success. The resulting hemming and hawing had yet other voices questioning the validity of all those complaints. Outside of those 1s, was the field as boring as the accusations made it out to be? Let me present…
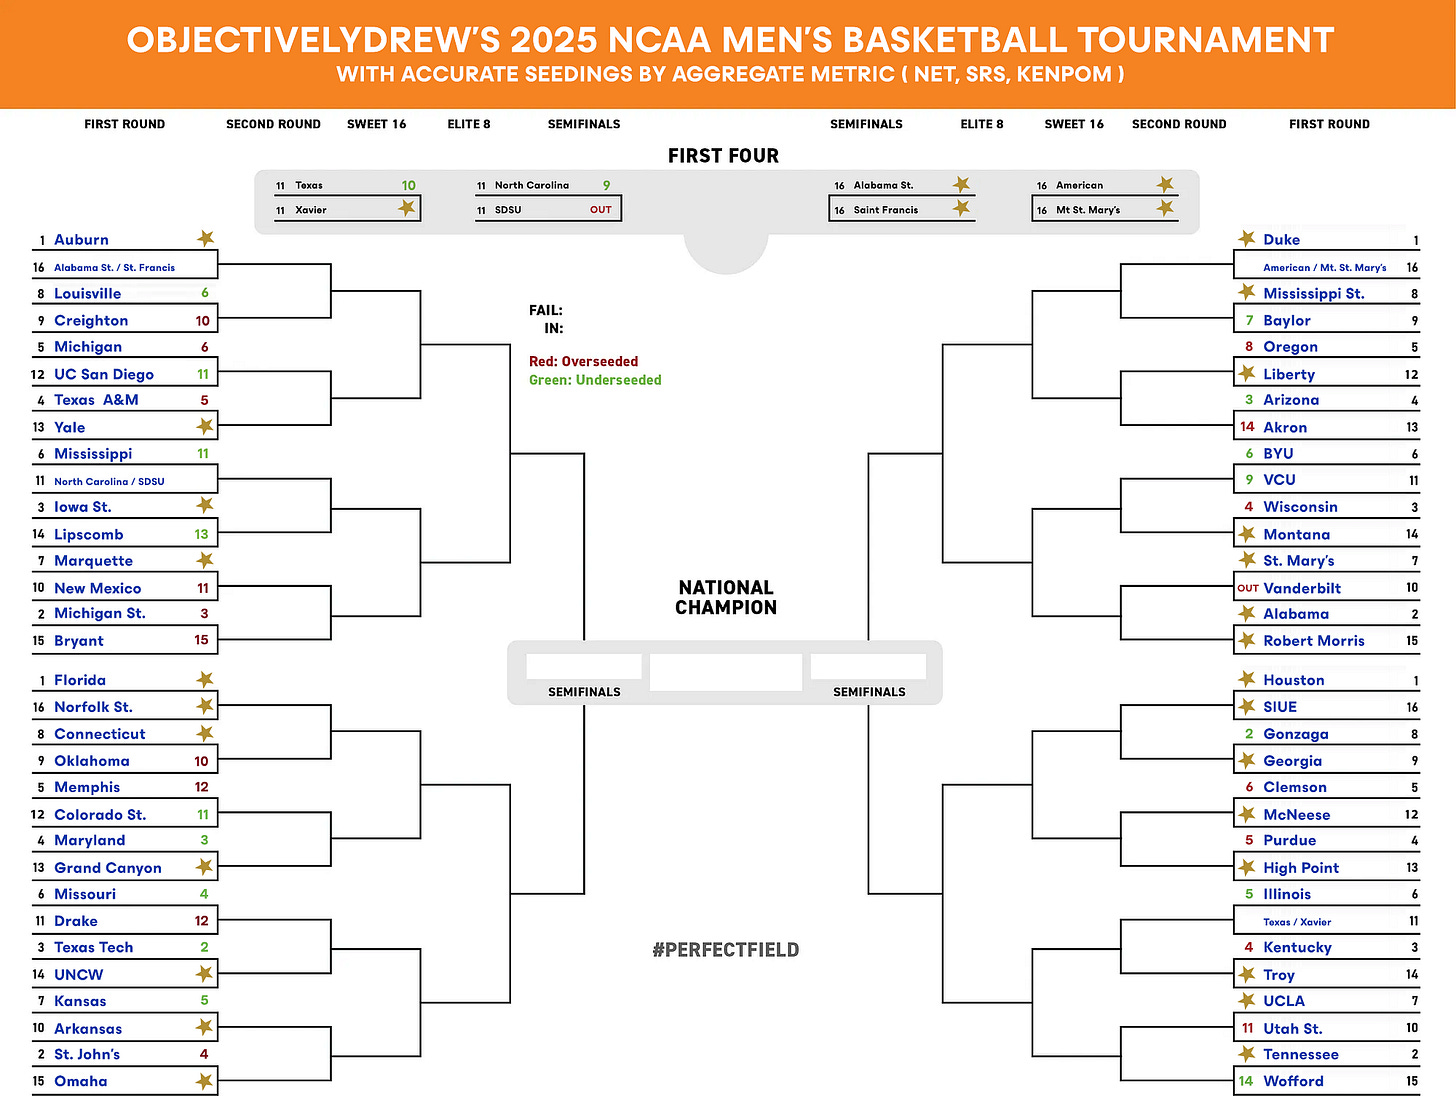
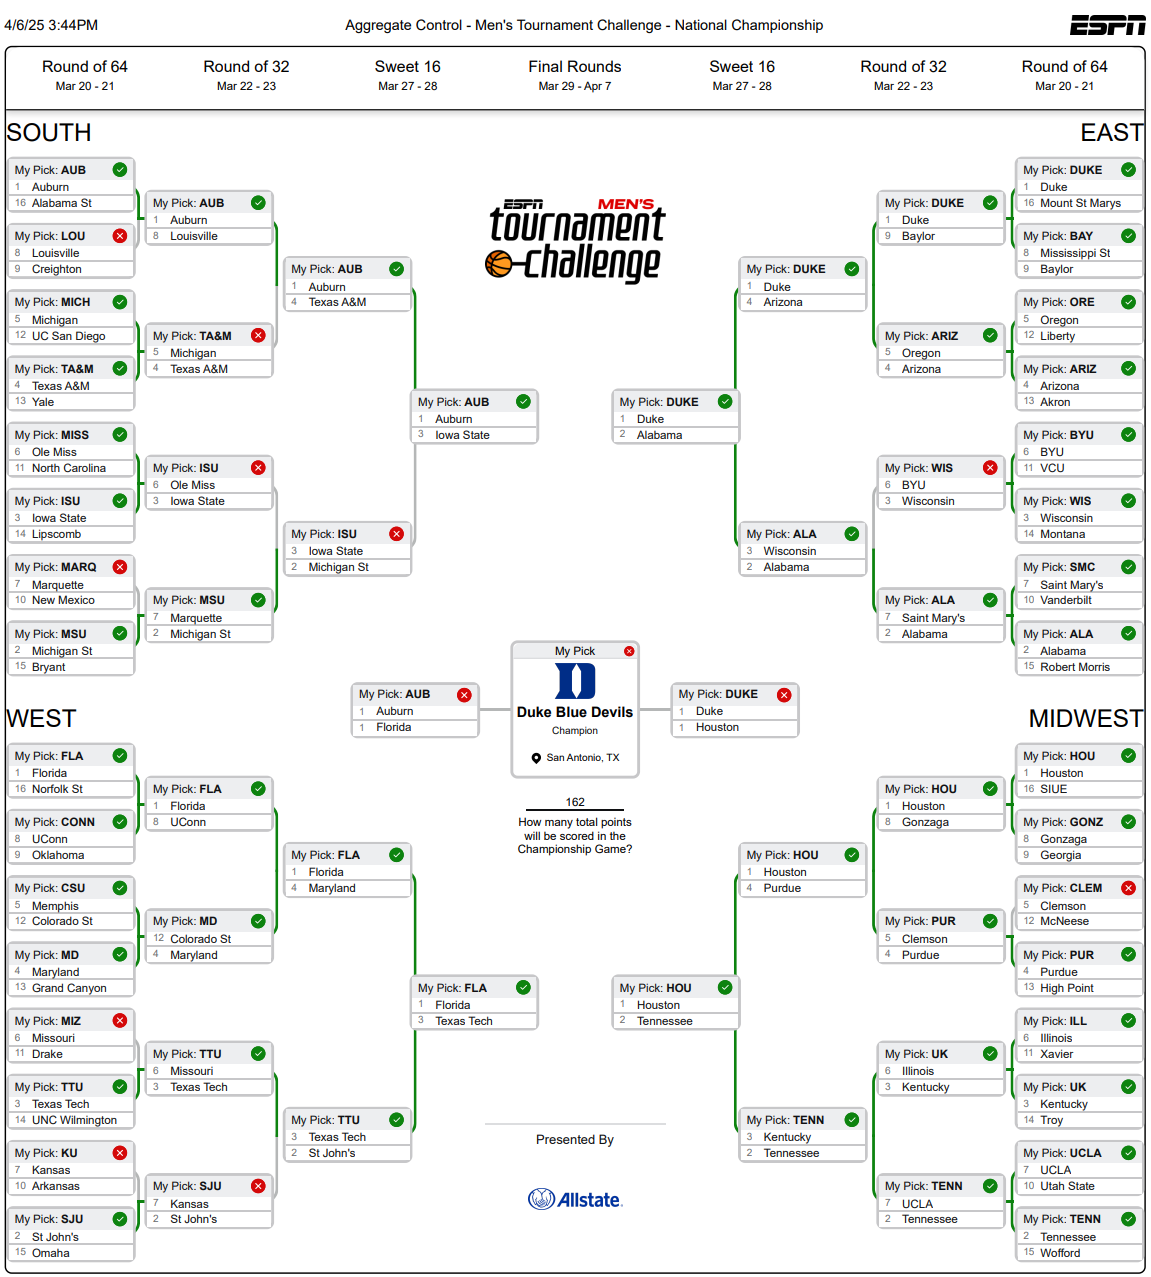
The Aggregate Control Bracket2:
Last year there were 9 upsets. It was the first time in 12 years there had been less than 10 upsets. That’s using the seeds handed out by the committee, which is less interesting to me than how teams are graded by statistical output. Two examples readily come to mind in 2025.
Biggest snub: 8-seeded Gonzaga was considered a 2-seed statistically.
False prophet: 5-seeded Memphis would’ve been a 12-seed; this is why you saw IRL 12-seed Colorado State lead Vegas spreads.
This year there were still 12 upsets! Maybe that’s not the 14 upsets of 2022 or 2023, but certainly not ultra-chalky. Even with the removal of the two 1v1 upsets, it’s still 10 — which is higher than the average of 8.5 since the dawn of the modern format.
Some may question the seeding of the tournament based on the outliers above. I loathe giving a clandestine, biased NCAA committee credit. As a body only capable of producing a subjective field, I believe a formula is better suited to the job. While I’ve long bemoaned that, the Lunacy of Lunardi, and the overall system as it stands, this year I have to give them some credit. I believe the NET and KenPom.com ranks were more visible in that selection room than in years past.

I hope it’s a trend that continues. This field came closer to the aggregate rankings than in any of the past 10 years I’ve tracked. Only two teams were left out who should have been in. My objective apologies to the fans of Ohio State and SMU, who had their at-large spots snapped up by bid bandits Vanderbilt and SDSU. The committee usually misses on 4–6 of the best at-large teams that should have been included; to have only two misses is shockingly accurate for their abilities.
Yes, it’s true that the most likely outcome for the Final Four came to fruition. Given the sheer volume of possibilities, that outcome was still not incredibly likely amongst simulations of the tournament. For the sake of argument, let’s look at how rarely even the most likely outcome occurs. With my predictive simulator fed the selection Sunday table of the season’s on-court data and run for 2000 simulations3, the 1-seeds had the following odds of reaching the final:
Duke 34.60%
Auburn 28.53%
Houston 22.87%
Florida 32.33%
Snap those into a function to determine the shared probability of occurring…
P(A∩B∩C∩D) = 5.091%4
Even with a field that felt top-heavy from the start, 5% odds don’t particularly feel like the outcome everyone expected. Was there chalk? For the 1-seeds, yes, of course. At those odds, I like to think of things simply as a different brand of chaos. These games were not something I found boring. But in the March Madness of 2025, it appears that the Big Feelings™ from some media personalities show even more chalky consistency than the assumed chalk of this bracket. Or, as one of my daughter’s wonderful books puts it:
“You know what’s really boring? When people say how bored they are!”
Next Up
I hope you haven’t been bored by the tournament, or by this analysis. But just in case, I’m cooking up something special—a simulated tournament of the worst 68 teams in Men’s D1 basketball. The Bottom Bracket promises to have much more interesting odds across the board and should provide the exact kind of chaos people want from a bracket that’s already proven impossible for the masses to correctly predict.
Sources: NET / KenPom / SRS. An aggregate rank on selection Sunday showed Duke as the most statistically dominant team. It wasn’t close.
Teams ranked by the same aggregate of the sources mentioned above.
Running copious simulations won’t change outcomes in a meaningful way. 2000 simulations yielded roughly the same numbers as the first 500. Running a million wouldn’t change things beyond a slight flattening out of probability curves, while perhaps revealing infinitesimal ranking details about non-contenders (Which 16-seed is most likely to win it all even though none have better odds than a thousandth of a percent, etc.).
Additional context: 2024’s NC State only had a 1.1% chance to make the Final Four. Odds of that particular Final Four occurring were just 0.01868653%.


